Signal Intensity Analysis
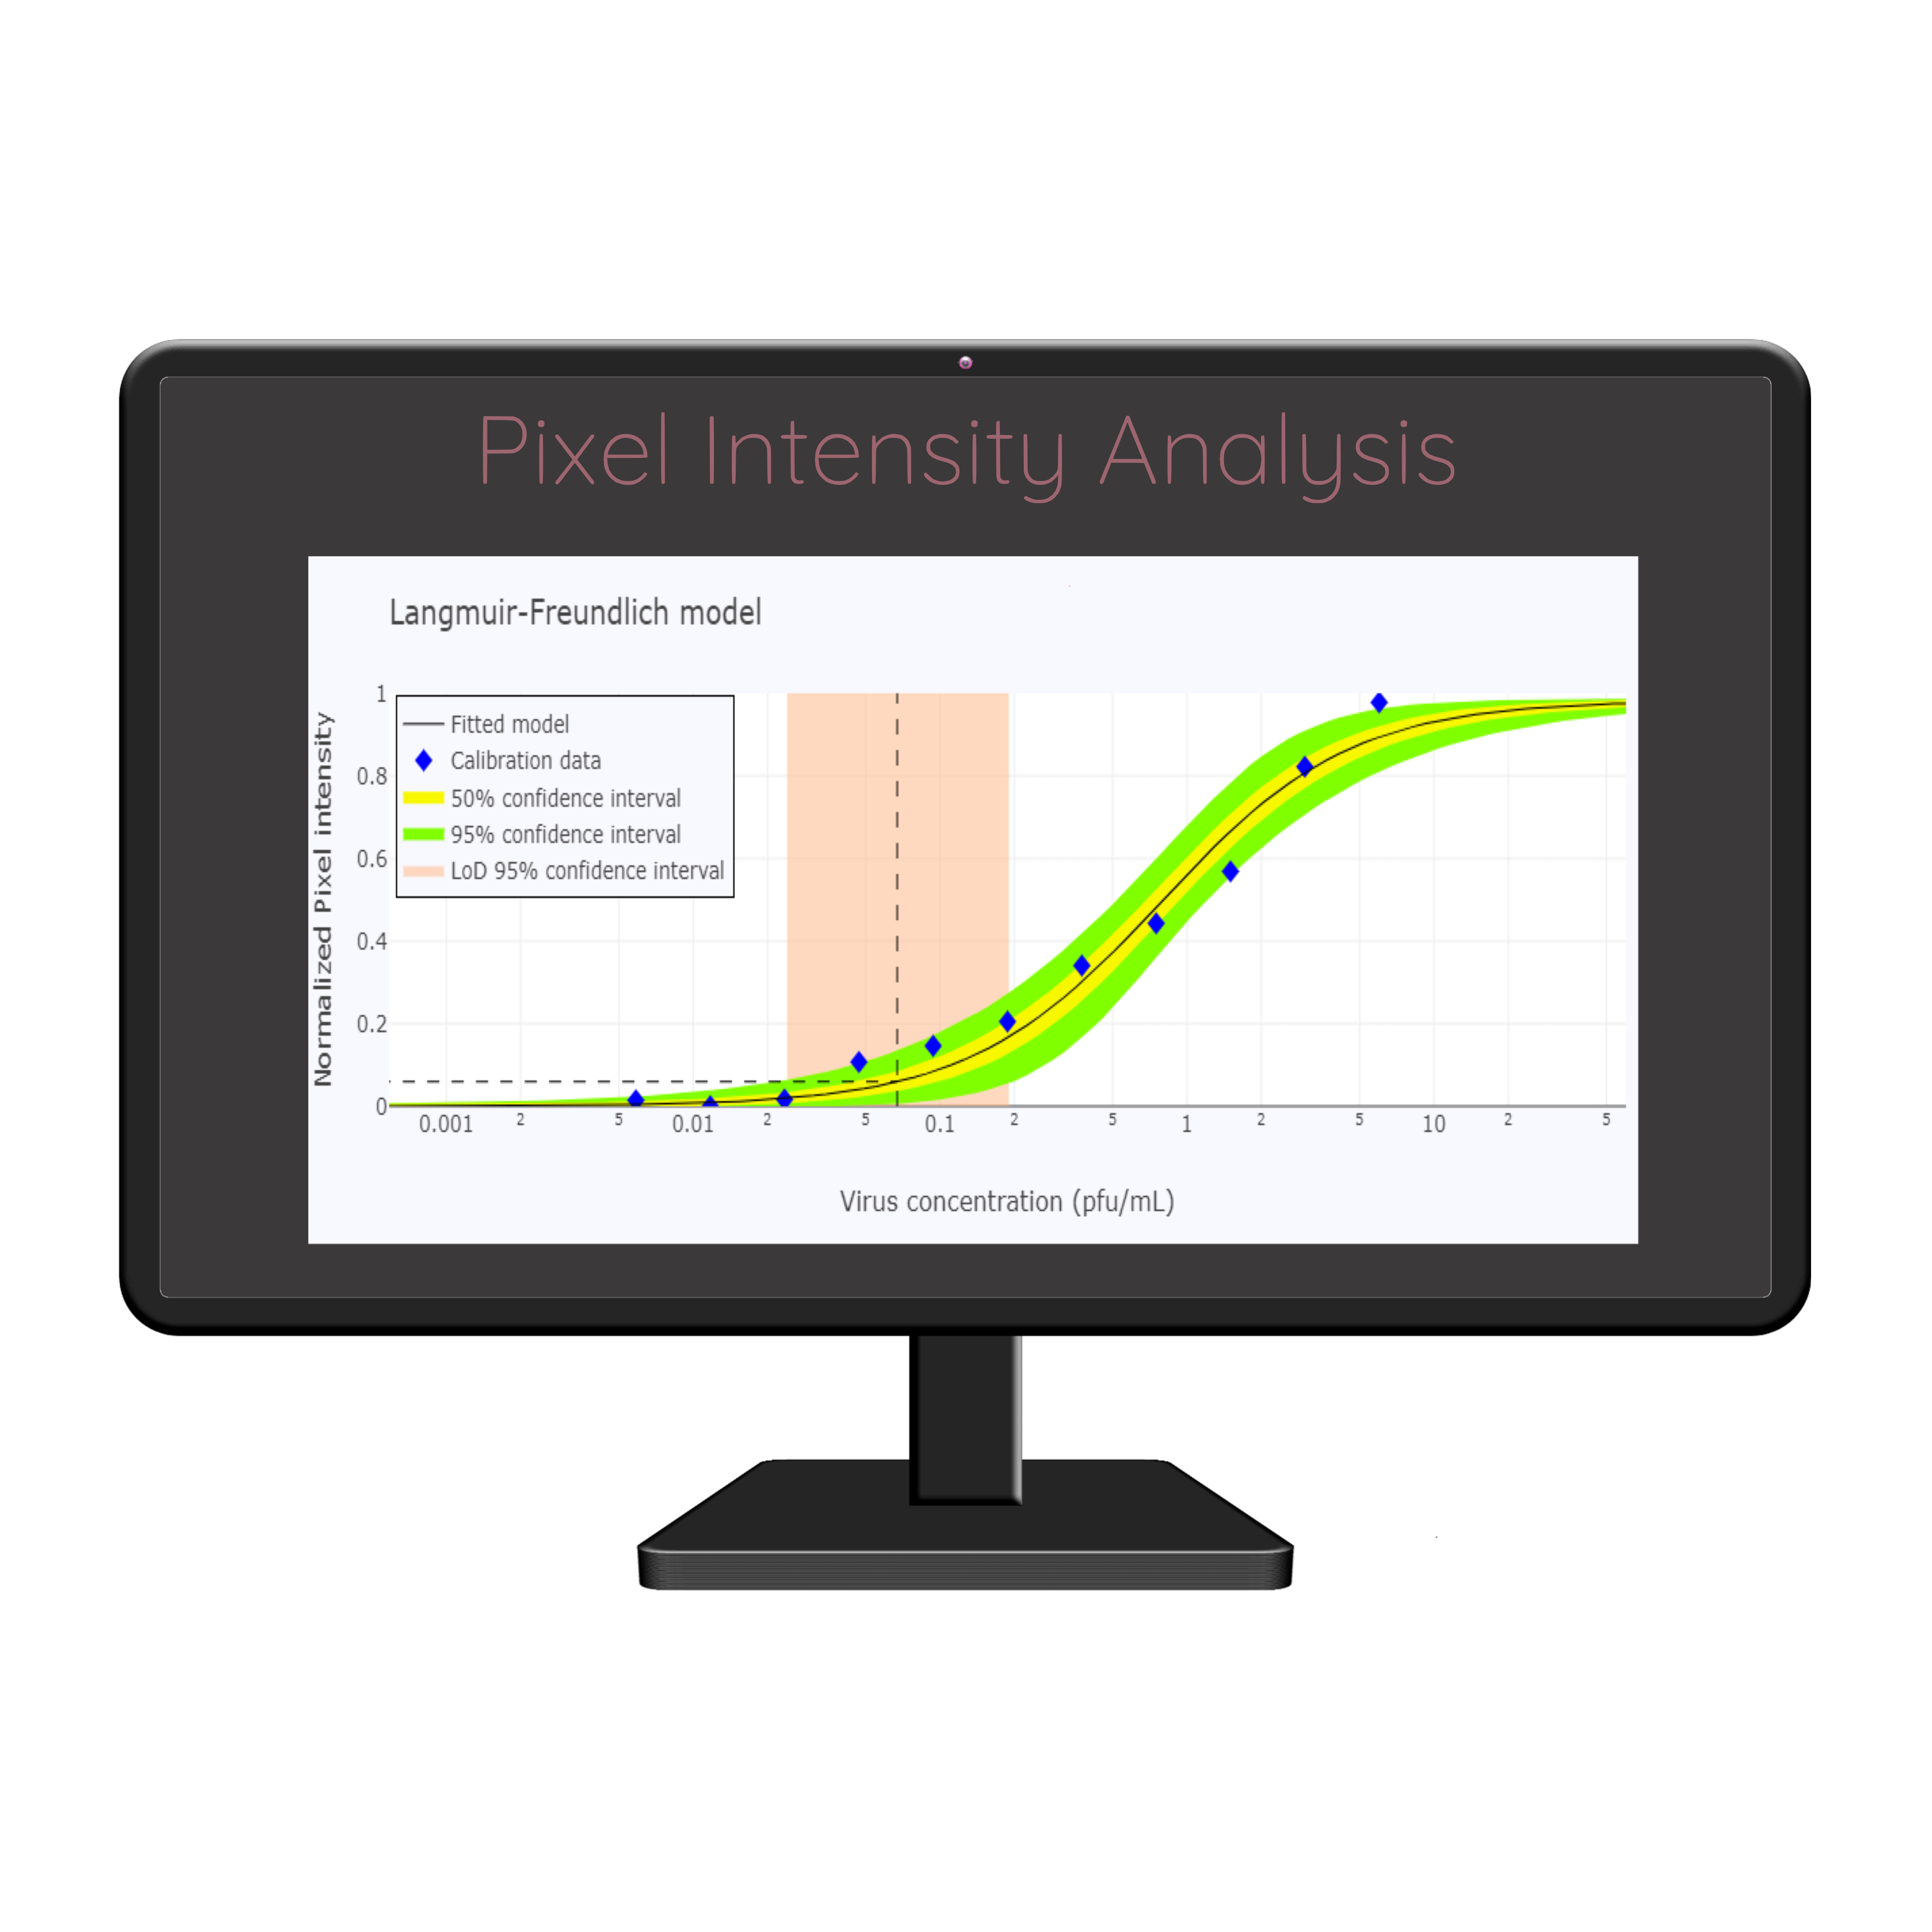
The intensity of the test band in the antigen test device is obtained by pixel image analysis. A photograph using any cell phone camera is utilized to convert the color intensity to a numerical standardized value using a grey scale (0-255). The normalized pixel intensity takes into consideration the background of the tests area, it allows corrections derived from the external photo factors (e.g. brightness conditions, type of phone, etc). The target is the nucleoprotein of SARS CoV-2. We derive three estimations that characterize the detection capacity to the protein, 1-Limit of Detection (LOD), 2-Adsorption Equilibrium Constant (Ka) and 3-Dissociation Constant (Kd) through the Langmuir-Freundlich model. The calculated protein of the virus present in the sample rises in a non-linear manner as signal intensity increases, as described by the model.
Go to site →
Webtools


Probability of Positive Agreement
Models the Probability of Positive Agreement as a function of various alternative variables, such as
qRT-PCR cycles, antigen test signal intensity, viral load or target protein concentration.
Calculates basic performance statistics for evaluating naked-eye antigen test binary assessment in comparison to
a reference standard.
Go to site →
Image Processing
Enables analysts to efficiently measure the signal intensity of antigen test devices captured in photographs within a target dilution series. It also
generates a range of files to support subsequent analyses of signal intensity and the probability of positive agreement.
Go to site →
Positive Agreement Balancer
Models the Probability of Positive Agreement from the clinical data adjusting the viral load (qRT-PCR Ct distribution of the data).
Calculates the expected performance metrics and compares it with the statistics derived from the original raw data.
Go to site →
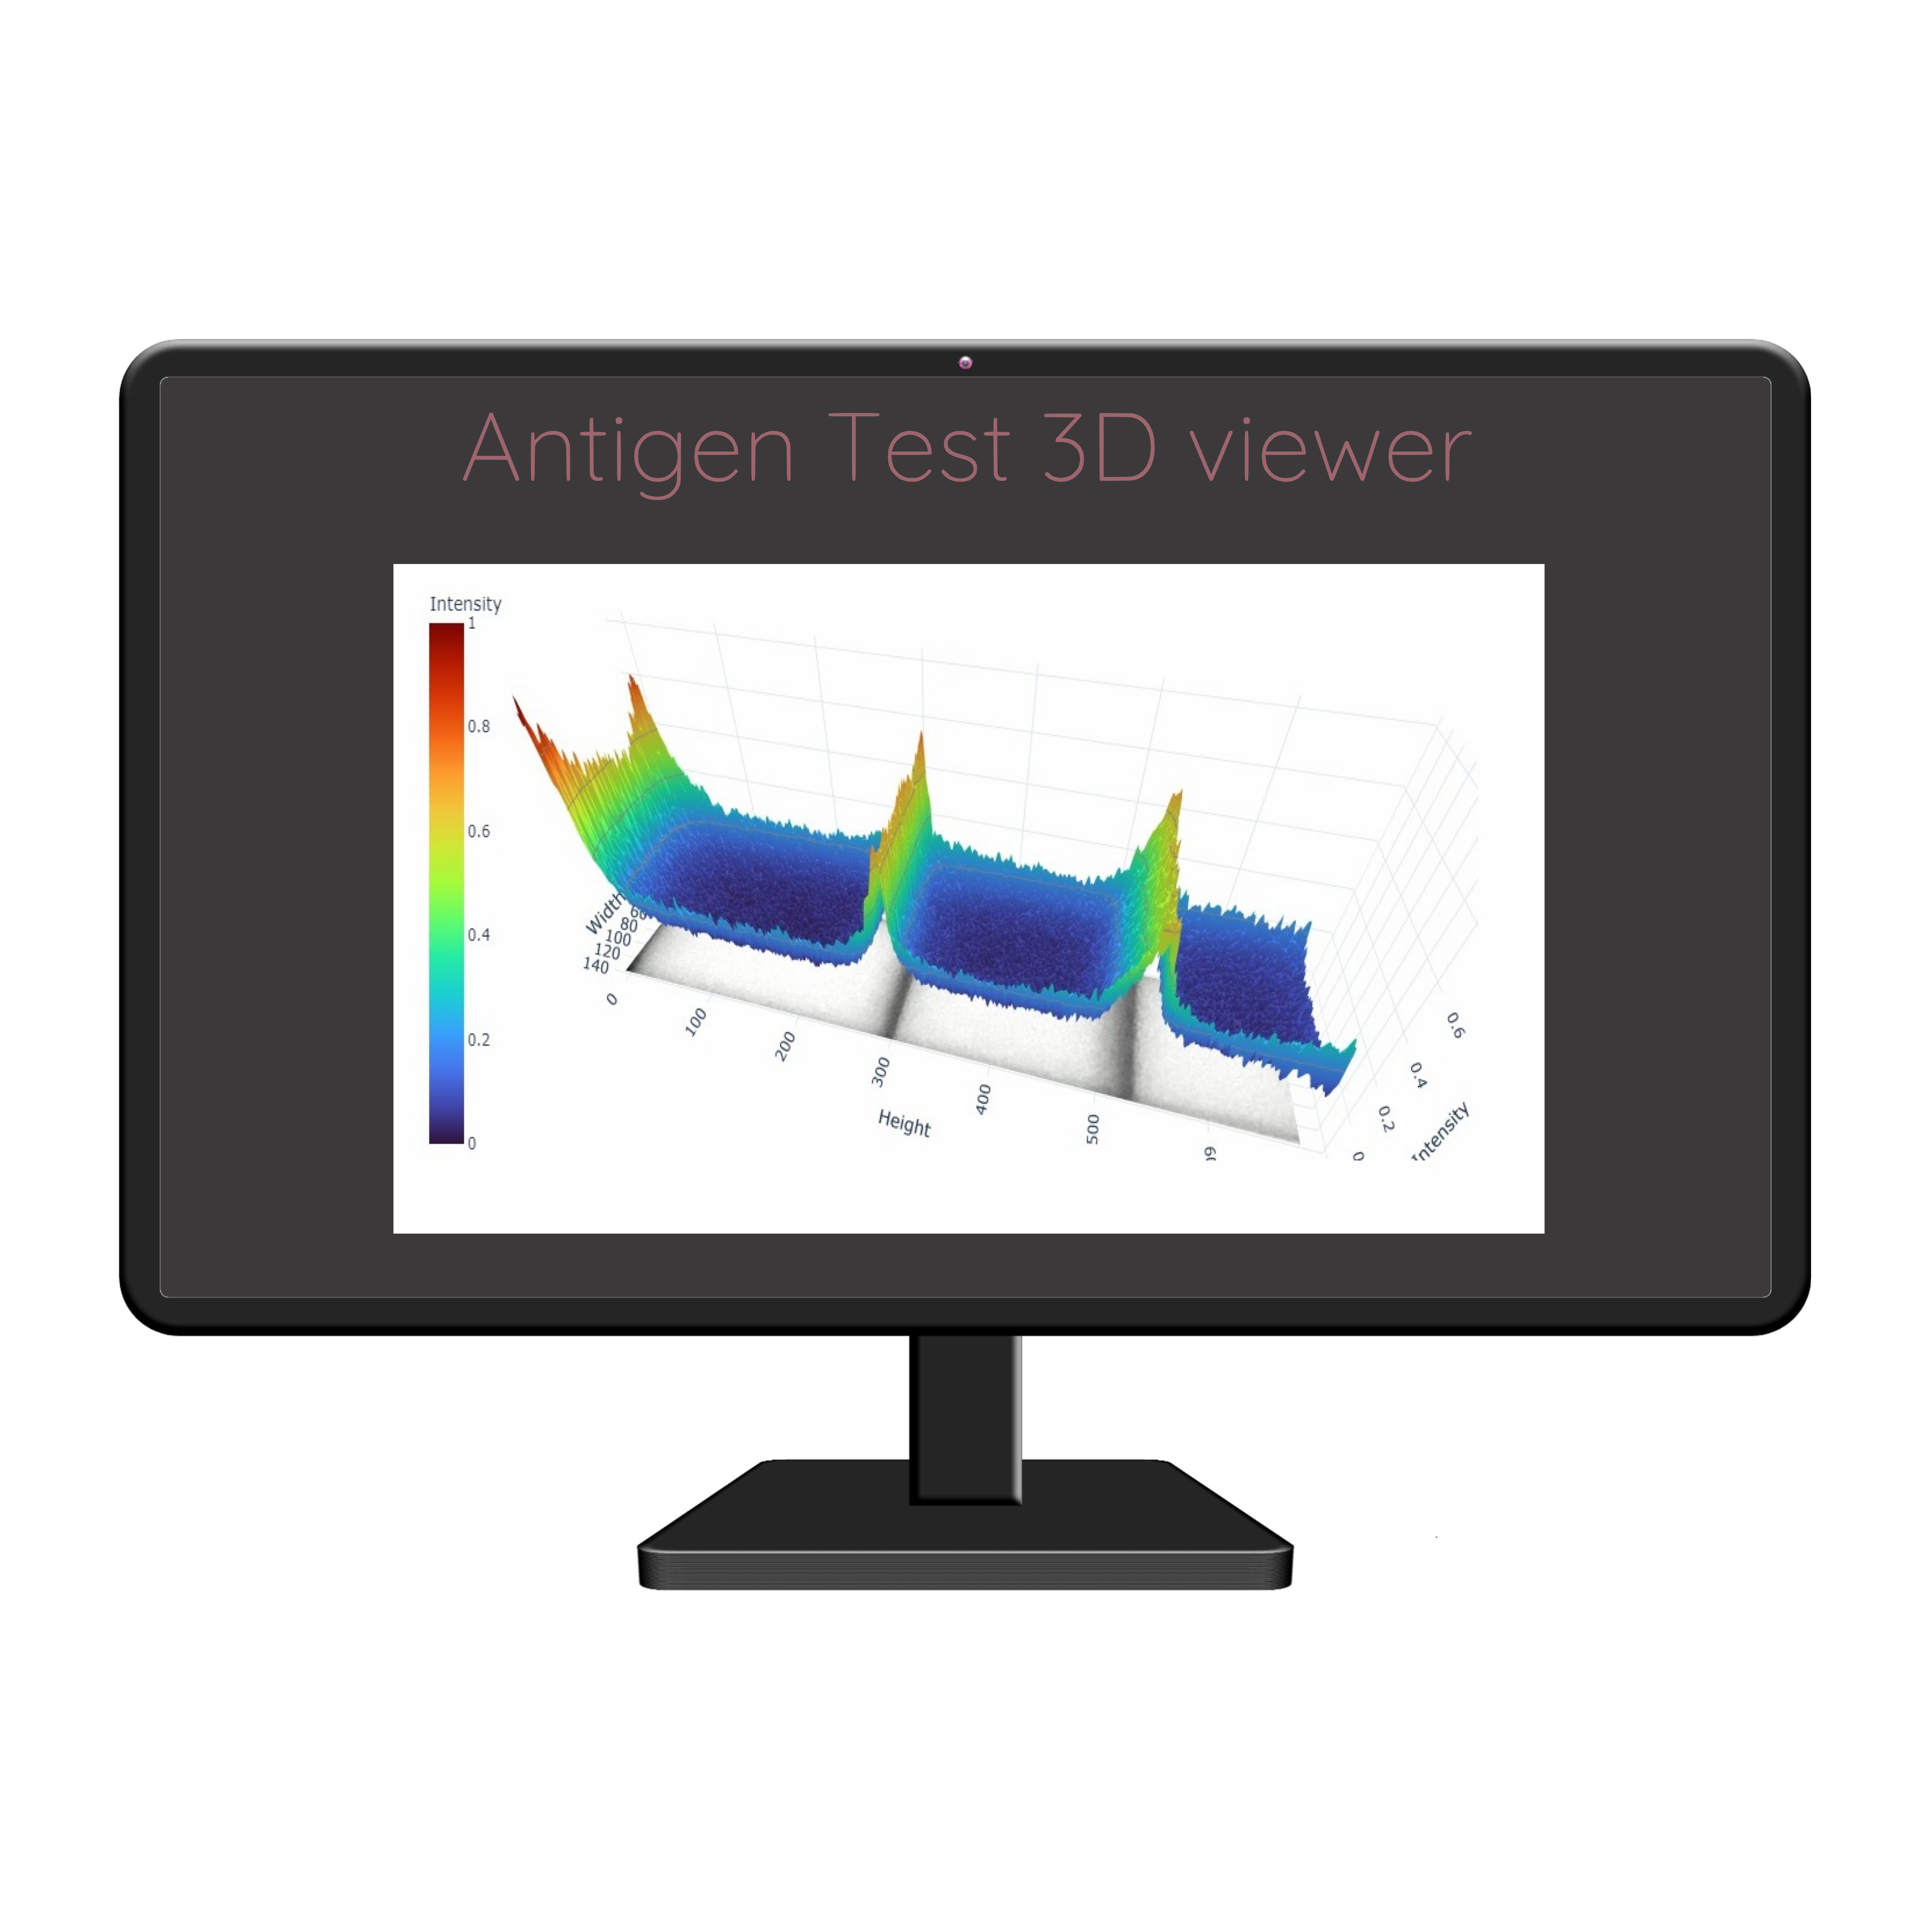
Antigen Test 3D viewer
Shows a 3D view of the antigen test strip results, allowing for detailed visual analysis. The color scale represents
pixel intensity, enhancing the interpretability of the data.
Go to site →
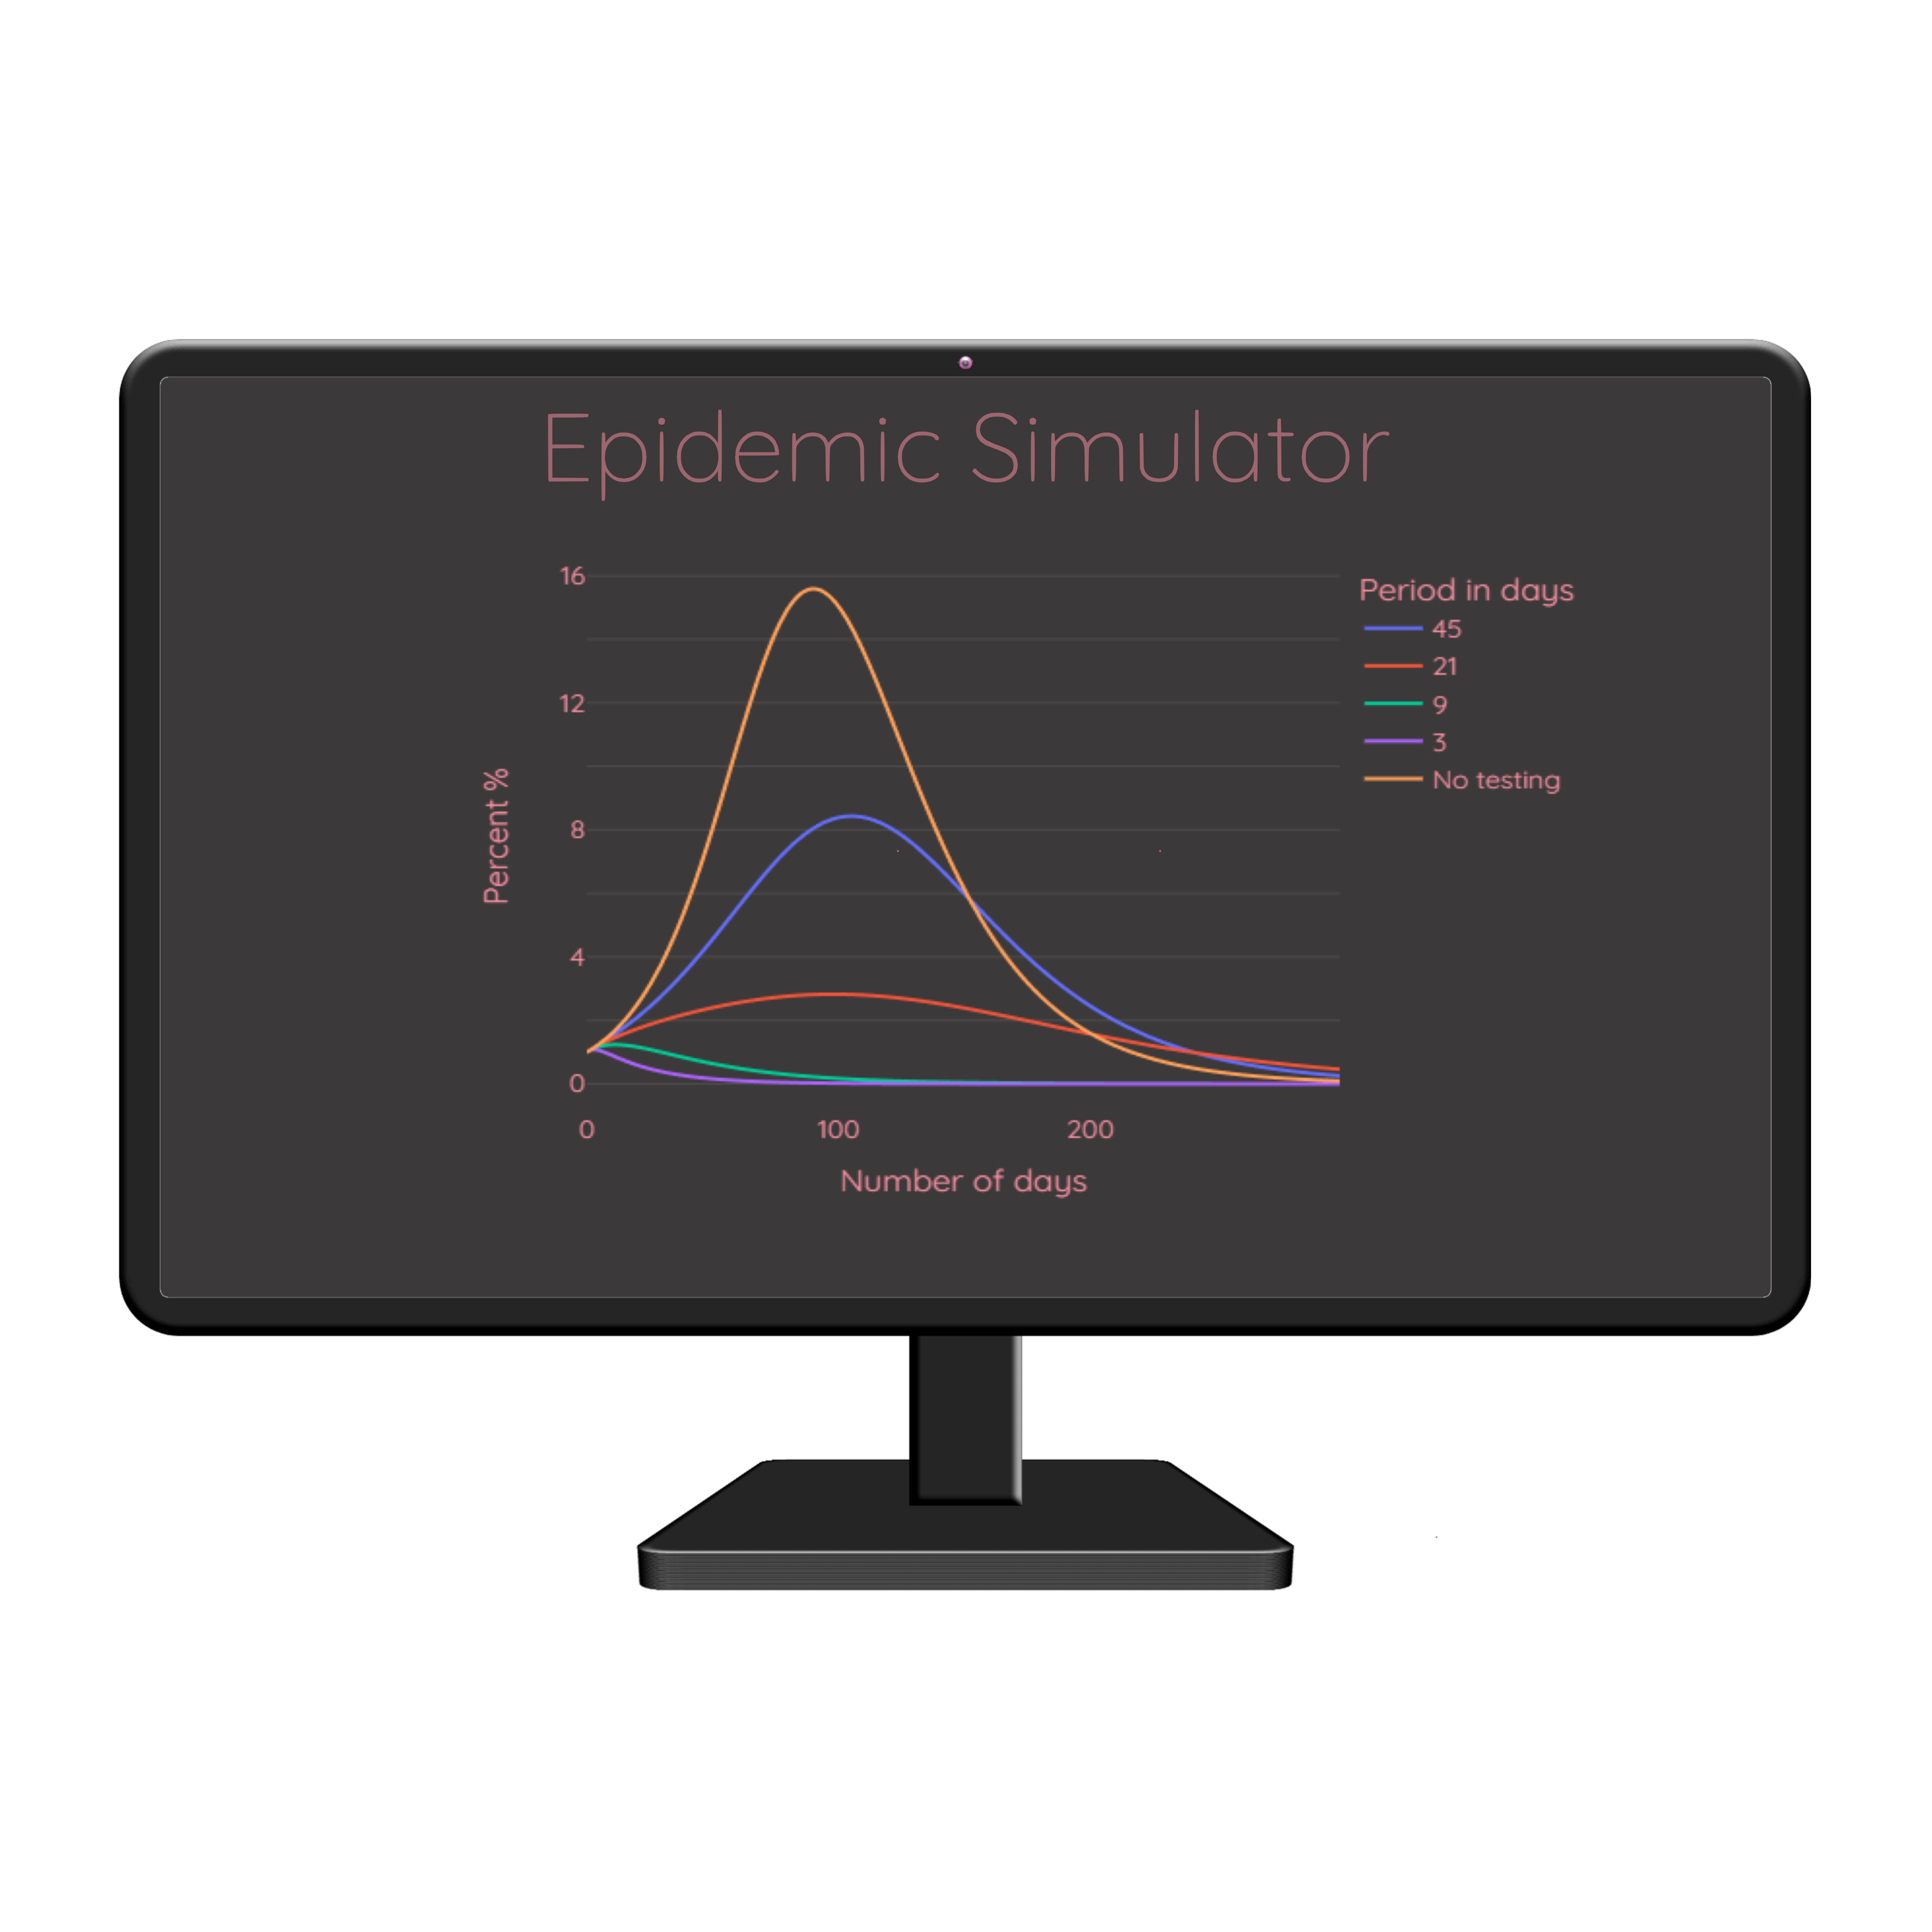
Epidemic Simulator
Models the effect of rapid antigen testing frequency in dissease epidemic dynamics. It takes into account
population-related factors and test adjustable
parameters, including sensitivity (Positive Percent Agreement -PPA), especificity (Negative Percent Agreement -NPA)
and the frequency of test application over a specified time frame.
Go to site →